


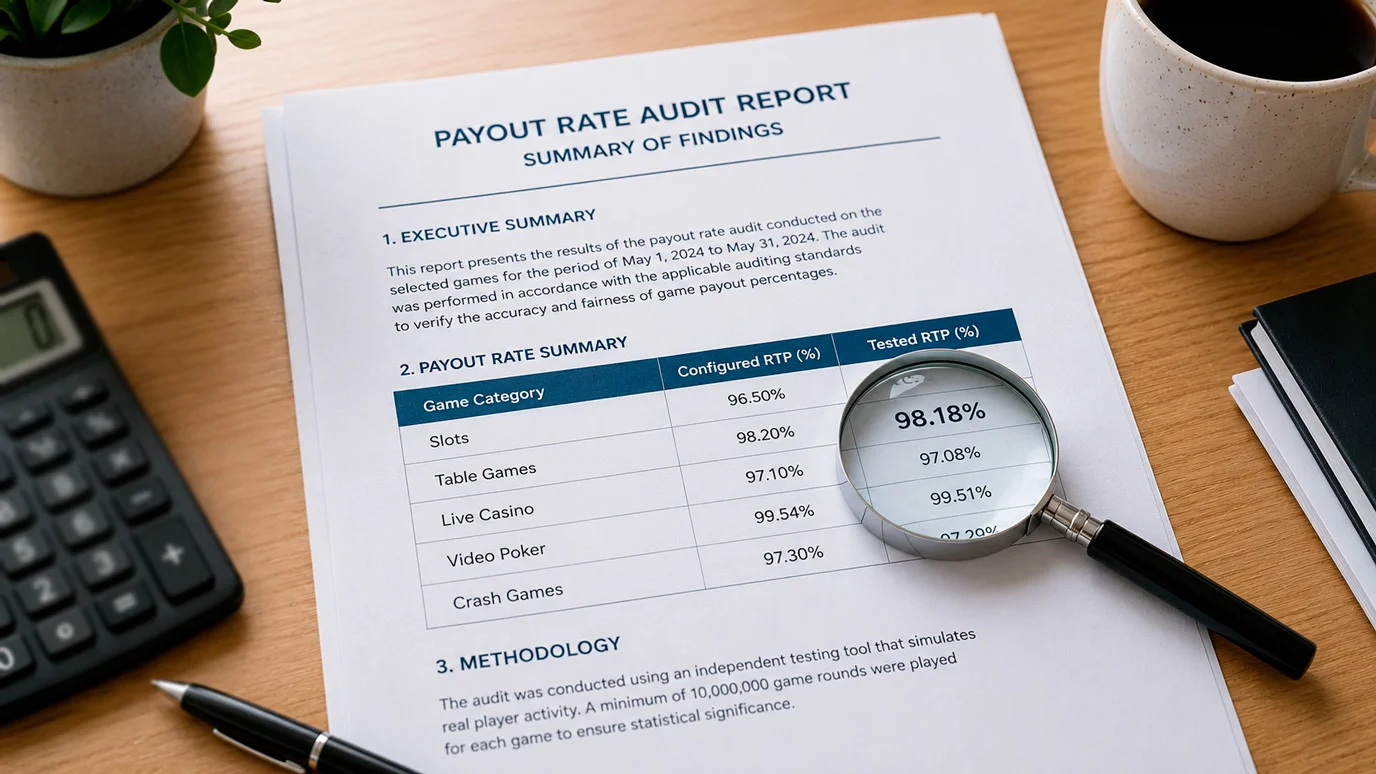
Every few months, someone sends me a screenshot of an operator advertising a “98.2% payout rate” and asks whether that makes it the best place to play. My answer is always the same: that number is real, it is audited, and it is almost completely useless for predicting your individual experience. The average RTP across UK-licensed online slots sits at about 96%, but an operator’s aggregate payout figure is a different animal entirely — it reflects the blended return across every game on the platform, weighted by play volume, over a reporting period. Understanding how that number is built, and why it often misleads, is essential before you use it to make decisions about where to play.
The per-game view of return: high RTP slots.
What “Overall Casino Payout Rate” Measures — and Its Limits
Last year I sat through a presentation by a mid-tier operator’s finance team where they walked through their monthly payout calculation. The process is more mechanical and less meaningful than most players assume.
An operator’s overall payout rate is total player returns divided by total player wagers across all games over a defined period, typically one month. If players collectively wagered £10 million and received £9.7 million back in winnings, the payout rate is 97%. Simple arithmetic, but the inputs are what matter.

The UK’s online casino and betting sector generated £7.8 billion in gross gaming yield during the year to March 2025 — that is the amount retained by operators after paying out winnings. GGY is effectively the inverse of the payout rate applied at industry scale. When an operator reports a 97% payout rate, they are saying their GGY was 3% of total wagering for that period. The figure is audited by independent testing houses and reported to the UKGC, so it is not fabricated. But it is an aggregate, and aggregates hide the details that matter to individual players.
The primary limitation is time-period sensitivity. A single large jackpot payout in a given month can spike the overall rate above 99%, while a month without major wins might drop it to 95%. Neither figure tells you anything about the next month. Operators publishing their “highest payout rate” are often selecting the most flattering reporting period, which is technically accurate but contextually misleading.

How a Casino’s Game Mix Skews Its Aggregate Payout Figure
Here is the part that never makes it into marketing copy. An operator’s payout rate is not the average RTP of their game library — it is the volume-weighted average. Games that attract more play have more influence on the overall figure.
Consider an operator with 2,000 slots averaging 96% RTP, a live blackjack section averaging 99.5% RTP, and a roulette section averaging 97.3% RTP. If 80% of total wagers go through slots, 15% through blackjack, and 5% through roulette, the aggregate payout rate is approximately 96.5% — heavily dominated by slot volume despite blackjack offering a significantly better return.
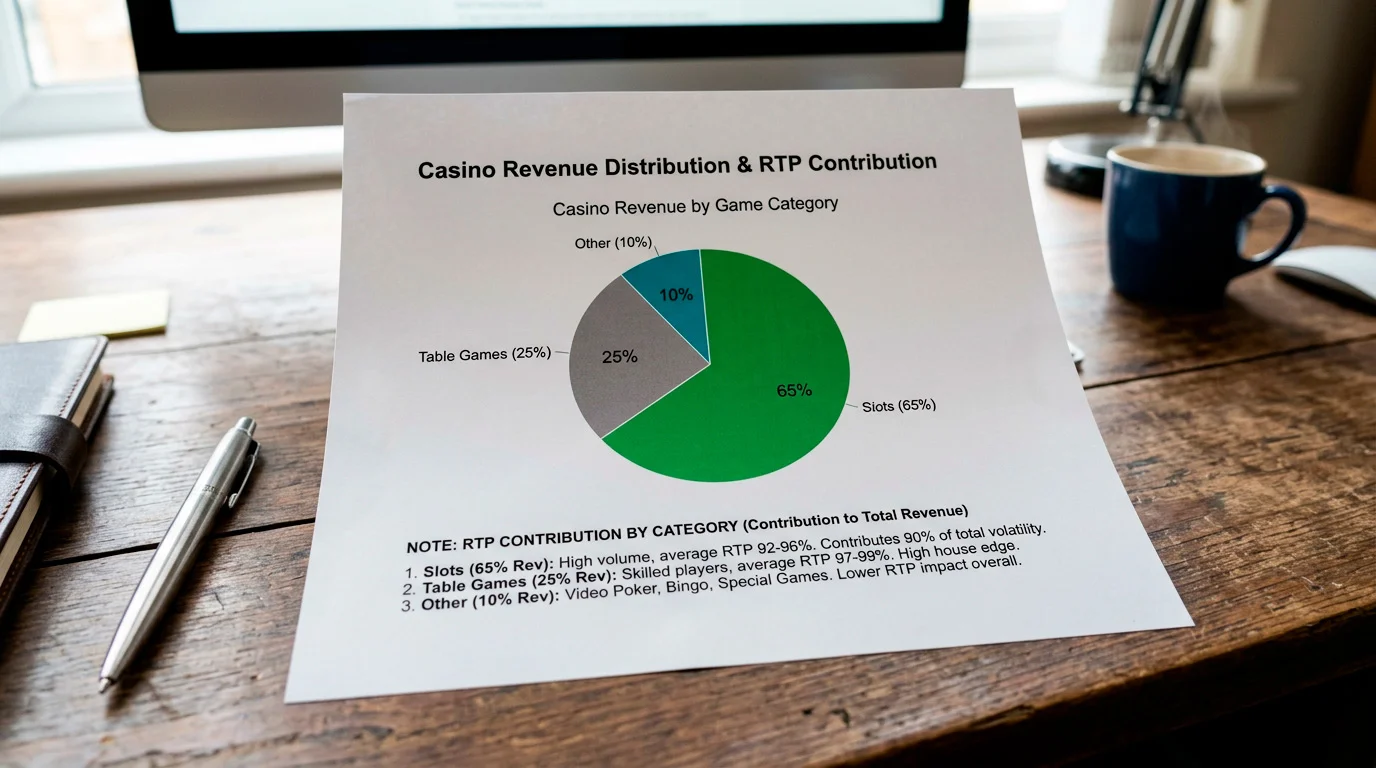
Now imagine a second operator with the same game library but a player base that skews toward table games — 50% slots, 35% blackjack, 15% roulette. Their aggregate payout rate climbs to roughly 97.3%, not because their games are better, but because their players gravitate toward higher-RTP formats. The operator with the “higher payout rate” is not offering a better product. They have a different customer mix.
This is why direct comparisons between operators’ published payout rates are fundamentally flawed. You are not comparing like with like. You are comparing the spending patterns of two different player populations refracted through the same mathematical lens. An operator could hypothetically improve their payout rate by removing popular low-RTP slots from their library, but that would reduce their game selection and likely their revenue. No operator optimises for payout rate at the expense of game variety.
The full picture is in our guide to UK real-money online casinos.
Progressive jackpot games add further distortion. When a progressive jackpot hits, the payout is attributed to the month it lands in. A £5 million jackpot at a mid-size operator can shift their monthly payout rate by several percentage points. The published figure captures this windfall, but a new player depositing the following month has no access to that past payout — the jackpot pool resets and rebuilds from zero.
Comparing Payout Rates Across UK-Licensed Operators
If aggregate payout rates are unreliable for comparison, what is the alternative? In eight years of reviewing operator data, I have found that game-level RTP is far more informative than platform-level aggregates.
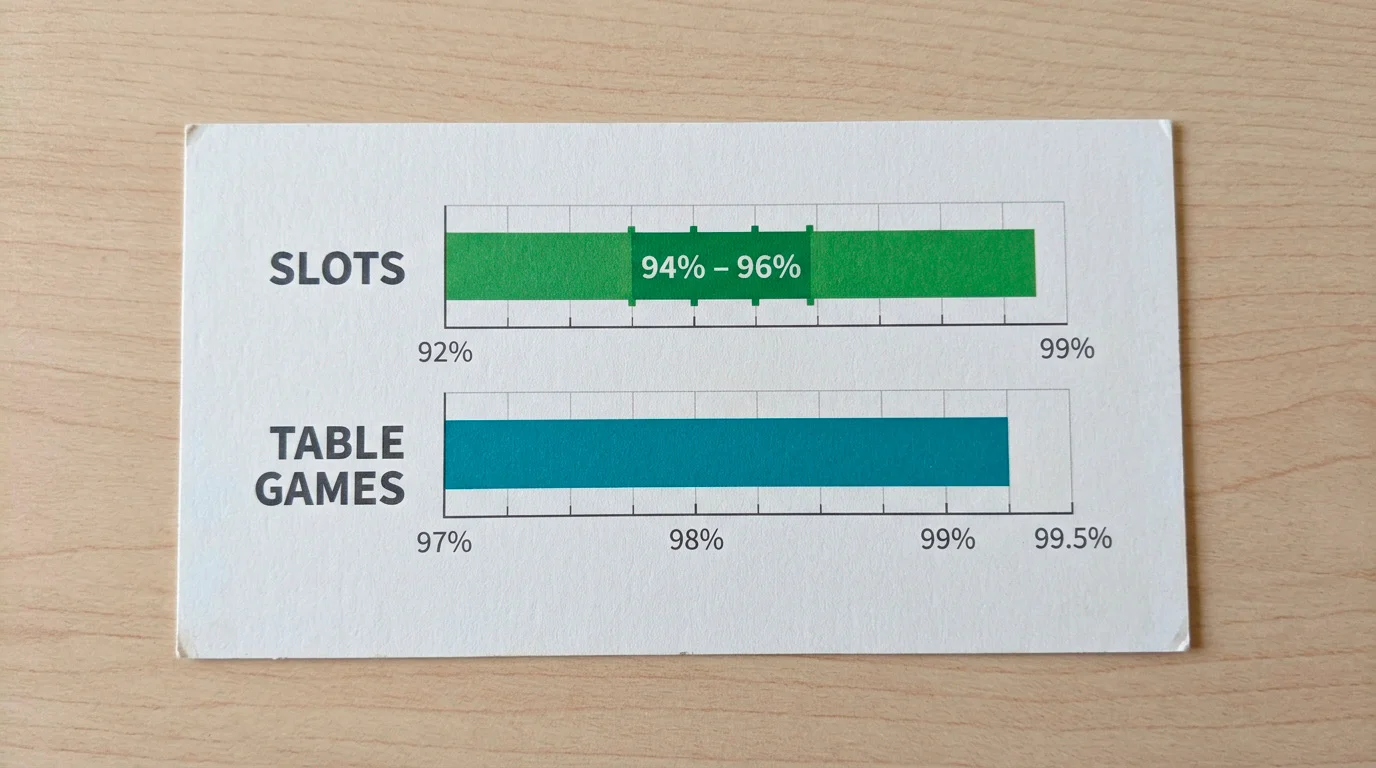
Instead of asking “which casino has the highest payout rate,” ask “which casino offers access to the specific high-RTP games I want to play.” The RTP of a given slot — say, 97.5% — is identical regardless of which operator hosts it (assuming the same game version and configuration). What differs between operators is the selection of games available, not the return rates of those games. An operator with Ugga Bugga (99.07% RTP) in their library offers a higher-RTP option than one without it, but that only matters if you actually intend to play Ugga Bugga.
Game configuration is the one variable where RTP can differ between operators on the same title. Some providers offer their games in multiple RTP configurations — for example, a slot might be available at 96.5%, 94.5%, or 92% RTP depending on the operator’s commercial agreement. The UKGC requires operators to make the active RTP version available to players, but the disclosure is not always prominent. Checking the in-game information screen before playing is the only reliable way to confirm which configuration you are on.

For a conceptual foundation on what RTP measures and how it interacts with house edge across different game types, the RTP explainer breaks down the mechanics in detail. The short version: compare games, not casinos. The aggregate number on an operator’s website is a marketing asset, not a decision-making tool.
Articles
Created by the "onlinecasinorealmoneyuk.com" editorial team.